


- Manufacturing Debonding Study of PVC/foam Core Sandwich Composite by Ultrasonic A-scan
Won Jong Jeong*, Sang Heon Yang*, Woo Cheol Jang**, YoungJin Shim***, Sang-Ha Hwang***, Hyung Doh Roh*, **†
* Department of Mechanical Engineering, Hanyang University ERICA
** BK21 Four ERICA-ACE Center, Hanyang University ERICA
*** Materials Science and Chemical Engineering Center, Institute for Advanced Engineering (IAE)This article is an open access article distributed under the terms of the Creative Commons Attribution Non-Commercial License (http://creativecommons.org/licenses/by-nc/4.0) which permits unrestricted non-commercial use, distribution, and reproduction in any medium, provided the original work is properly cited.
This study presents a pointwise ultrasonic A-scan method for detecting interfacial debonding in co-cured CFRP/PVC foam core sandwich composites. A 10 × 10 grid-based measurement was performed on specimens with and without adhesive film, acquiring A-scan signals from 100 discrete points per sample. The collected waveforms were averaged and analyzed in both time and frequency domains. Key indicators such as tensile test, waveform amplitude, weighted root mean square (RMS) energy, and spectral amplitude were extracted to distinguish bonded and debonded regions. Results showed consistent differences in tensile test and weighted RMS energy difference (ΔE%), primarily attributed to variations in resin distribution and interfacial bonding quality. Energy-based imaging and normalization techniques further enhanced the analysis of resin distribution and visual differentiation between sound and defective areas. The proposed method demonstrates that pointwise A-scan acquisition, combined with signal averaging and energy analysis, offers a practical and non-destructive approach for assessing hidden debonding in composite sandwich structures.
Keywords: Ultrasonic A-scan, CFRP sandwich composite, Non-destructive evaluation (NDE)
Sandwich composite structures were first developed in the aerospace sector during the 1940s and have since been widely applied in various fields such as wind turbine blades, high-speed trains, naval platforms, unmanned aerial vehicles (UAVs), and civil aircraft structures [1]. These structures combine high-strength face sheets with lightweight cores to minimize weight while providing excellent bending stiffness and energy absorption capacity [2,3]. In particular, they are extensively used in applications requiring long-term durability and impact resistance, such as aircraft horizontal stabilizers, ship decks, and wind turbine blades [4].
Such composite structures are typically composed of high-strength carbon fiber reinforced polymer (CFRP) skins and low-density polymeric foam cores. Among these, closed-cell polyvinyl chloride (PVC) foam is widely used due to its superior mechanical stability and thermal durability [5]. However, during the manufacturing process, defects—especially interfacial debonding between the core and face sheets—can occur, which critically affect structural reliability and directly influence damage behavior and residual life prediction during long-term operation [6].
In particular, sandwich structures fabricated via co-curing without adhesives are prone to microscopic voids or bonding defects at the interface. Since such defects are not easily detectable by visual inspection, a quantitative and non-destructive evaluation method is essential [7].
Conventional non-destructive testing (NDT) techniques commonly involve water immersion scanning using C-scan or phased array ultrasonic testing (PAUT), which are effective in generating 2D images for qualitative assessment of defect locations [8,9]. However, these methods require immersion tanks and precision automation systems, limiting their applicability in field environments due to constraints in time, cost, and logistics.
In this study, a single contact ultrasonic probe was employed to acquire A-scan waveforms through surface coupling. A segmental energy-based analysis was conducted on reflected signals to quantitatively assess the bonding quality of co-cured sandwich composites with and without adhesive film. By setting time-gated windows in the signal, average energy values were extracted, and the results were experimentally validated through comparison with tensile test outcomes based on ASTM C297 standards.
For each specimen, all 100 acquired A-scan signals were individually analyzed to identify the time interval (2–6 μs) in which energy variation was most pronounced, and this interval was set as the gating window for quantitative evaluation. Instead of using a fixed window, the start of the gate (ta) was dynamically determined for each average waveform by automatically extracting the first major peak occurring after 1.8 μs, while the end point (tb) was fixed at 6 μs. This approach allowed the gating interval to be adaptively set for each specimen, thereby reflecting possible time shifts in the waveform position.
The gated energy for each waveform was calculated as the root mean square (RMS) value of the averaged waveform over the interval [ta, tb], that is, by squaring the amplitude, integrating over the interval, dividing by the window length, and finally taking the square root.
The RMS energies of all 100 waveforms were sorted in ascending order, and the representative mean waveform and energy were computed by averaging only the middle 50% (i.e., excluding the upper and lower 25% to minimize the influence of noise and outliers), according to 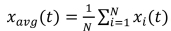 .
.
To provide a normalized assessment of bonding quality for each specimen, a weighting factor was introduced, defined as the ratio of the gated RMS energy to the RMS energy over the entire signal duration. This weighting ensures that only the most relevant portion of the reflected signal is emphasized, accurately reflecting the impact of interfacial debonding on the total energy profile.
Finally, the weighted percentage change in gated RMS energy between AF and NF specimens was used as the main quantitative indicator for bonding quality assessment.
Mathematically, the RMS energy in the gating window [ta, tb] was calculated as 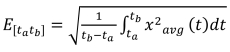 where xavg(t) is the mean waveform obtained from the median 50%.
The weighting factor is defined as and the final weighted  change is computed as
 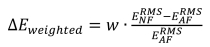 ×100.
×100.
Through this stepwise approach, only the energy changes in the physically significant window are quantitatively captured.
Consequently, this study proposes a simple surface-contact A-scan technique capable of detecting interfacial debonding in co-cured composites without the need for expensive immersion-based systems. The method offers promising potential as a practical NDT approach for quality assurance and service-life prediction in aerospace and marine composite structures.
2.1 Material Property
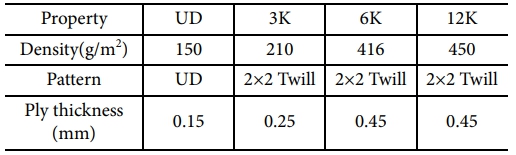
In this study, sandwich composite specimens were fabricated using four types of carbon fiber reinforced plastic (CFRP) face sheets and polyvinyl chloride (PVC) foam cores. Detailed material properties and fiber architectures of the face sheets are summarized in Table 1.
All face sheets were made from epoxy-impregnated prepregs. Each prepreg was molded by the hot press method under identical curing conditions (preheating at 80°C, followed by main curing at 130°C). The bonding interface between the face sheet and the core was controlled under two distinct conditions, depending on the presence or absence of an adhesive film.
The core material was Airex 70.75 foam (3A Composites, Switzerland), with a nominal density of approximately 80 kg/m³ and a thickness of 5 mm. This foam features a closed-cell structure, offering high strength and thermal stability suitable for co-curing processes.
A total of eight specimens were prepared: four with a conventional bonding condition that includes an adhesive film (AF: Adhesive Film), and four with no adhesive film (NF: No Film) to simulate insufficient resin infiltration at the interface.
The adhesive film used in this study was XPREG¢ç XA120 (Easy Composites Ltd., UK), a structural epoxy-based film adhesive suitable for high-strength bonding of foam cores, honeycomb, and metal inserts, and applicable to thermoset prepreg molding processes.
Ultrasonic testing and tensile testing were performed for all eight specimens to evaluate the correlation between manufacturing conditions and interfacial bonding quality.
2.2 Sample Preparation & Tensile Test
The CFRP/PVC foam core sandwich composite specimens used in this study were prepared for flatwise tensile testing in accordance with ASTM C297/C297M to evaluate interfacial bond strength. Eight different configurations were defined based on the combination of CFRP face sheet type (UD, 3K, 6K, 12K), presence or absence of adhesive film (Film / No Film), and hot press manufacturing method. Five identical specimens were produced, resulting in a total of 40 specimens.
The original composite panels were fabricated in a square shape with dimensions of 240 mm × 240 mm. From each panel, small-scale tensile coupons of 25 mm × 25 mm were extracted for testing. After co-curing and prepreg layup, panels were cut to ASTM specifications using an NC machining system. To prevent premature delamination or fracture during cutting, tool wear and feed rate were closely monitored throughout the process. The external dimensions and alignment of all specimens were inspected prior to testing to ensure consistency.
Metal loading blocks were bonded to both ends of each specimen to facilitate fixture attachment in the tensile test system. A structural adhesive (3M 08115) was used for bonding, and sufficient time was allowed for complete curing under ambient conditions. During assembly, fixtures were employed to maintain planar alignment and ensure uniform stress distribution.
To avoid torsion or eccentric loading during testing, a custom jig with three degrees of freedom was used, enabling failure under pure tensile conditions. Prior to loading, clamping conditions were repeatedly checked to prevent slippage during force application.
Additionally, flatwise tensile tests were conducted according to ASTM C297/C297M to evaluate interfacial bonding characteristics. This test is widely recognized as a standard method for quantitatively assessing the bonding integrity between the core and face sheet in sandwich composites. In this study, a universal testing machine (UTM) was used to apply tensile load, with a constant displacement rate of 0.5 mm/min.
Both load and displacement were continuously monitored and recorded throughout the experiment.
2.3 Ultrasonic Inspection
Ultrasonic A-scan testing was conducted in accordance with ASTM E2580, utilizing a manual inspection approach.
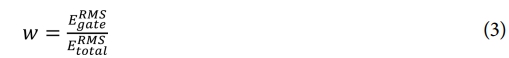
To enable precise pressure and displacement control during scanning, a micrometer-equipped translation stage was mounted onto a custom 3D-printed jig, as pictured in Fig. 1(b). As shown in Fig. 1 (a), each 25 × 25 mm specimen was scanned in both horizontal and vertical directions at 0.5 mm intervals, resulting in a 10 × 10 grid. A total of 100 A-scan waveforms were acquired from each specimen through this array-based scanning routine.
High-viscosity glycerin was selected as the couplant due to its favorable shear stress transmission properties. A pulse-echo inspection was performed using an XTR-2022 pulser/receiver unit in combination with a 5 MHz contact probe (17 mm diameter), operated at a center frequency of 2.25 MHz.
2.3.1 Waveform Normalizing
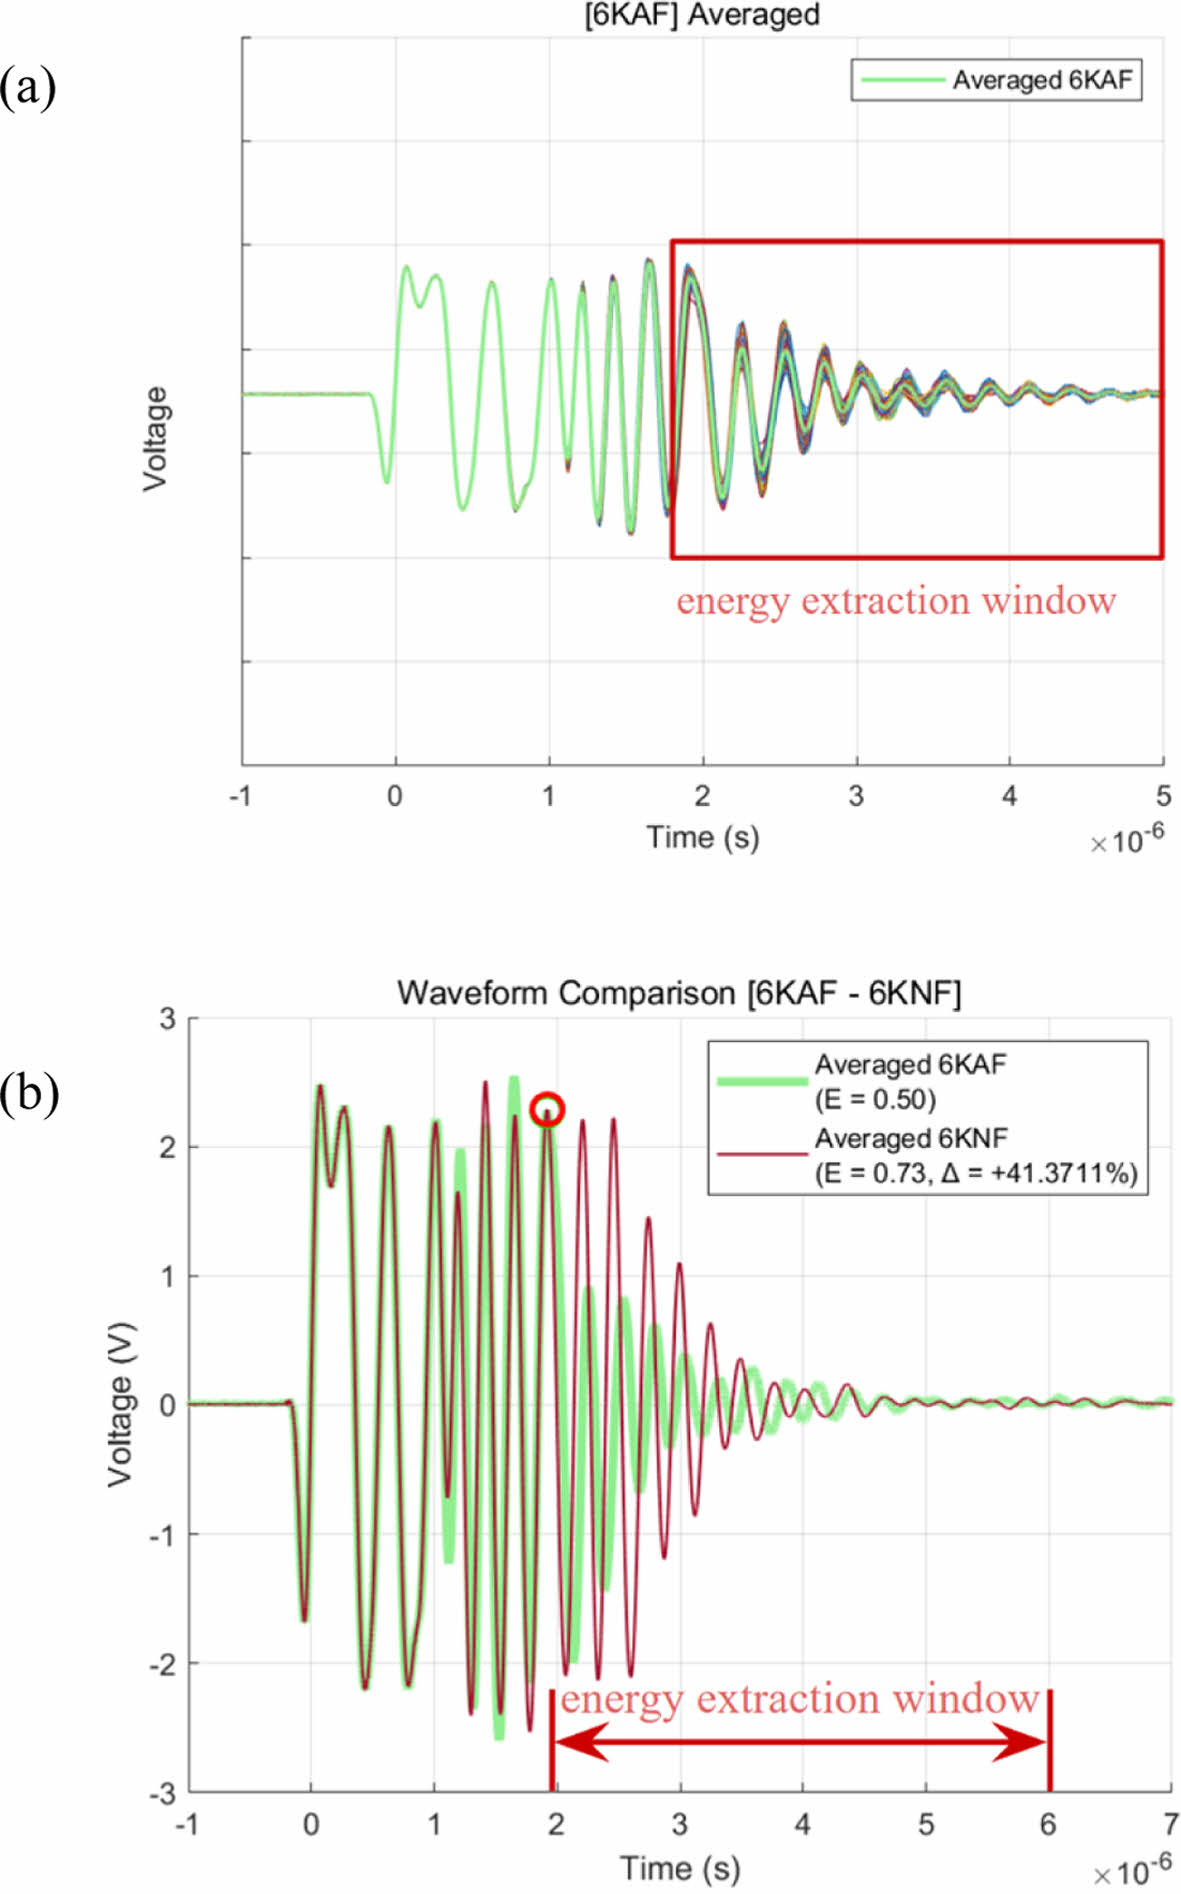
For each specimen, a total of 100 A-scan waveforms were acquired, and the region showing the most pronounced energy variation was identified as the 2–6 μs interval. As illustrated in Fig. 2(a), this interval corresponds to the section of the averaged waveform in which a significant change in energy is visually observedand was subsequently used as the gating window for energy extraction in all further analyses.
Rather than simply fixing this interval, however, an additional peak detection and automatic gating procedure was implemented to more precisely determine the actual onset of energy variation for each averaged waveform.
Specifically, for each averaged waveform, the first major peak occurring after 1.8 μs was automatically detected. The time of this extracted peak ta was set as the start of the gating window. The end of the gate tb was fixed at 6 μs (waveform end), so that the final gating interval was dynamically set as [first peak, 6 μs]. This method accounts for possible time-axis shifts and small positional variations of waveforms among specimens, and is designed to improve the accuracy of energy computation within the selected interval.
The energy for each waveform was then calculated as the root mean square (RMS) energy over the interval [ta, tb], by integrating the squared averaged waveform over time, dividing by the length of the interval, and taking the square root. This can be expressed mathematically as Eq. (1)
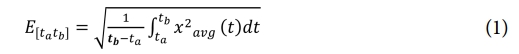
where xavg(t) denotes the averaged waveform, and ta and tb are the start and end times of the gating interval, respectively.
The averaged waveform xavg(t) was obtained by summing all waveforms within the same interval and dividing by the total number of signals N, as expressed in Eq. (2)

Here, x-(t) is the i-th waveform, and N is the number of waveforms used for averaging (e.g., the median 50).
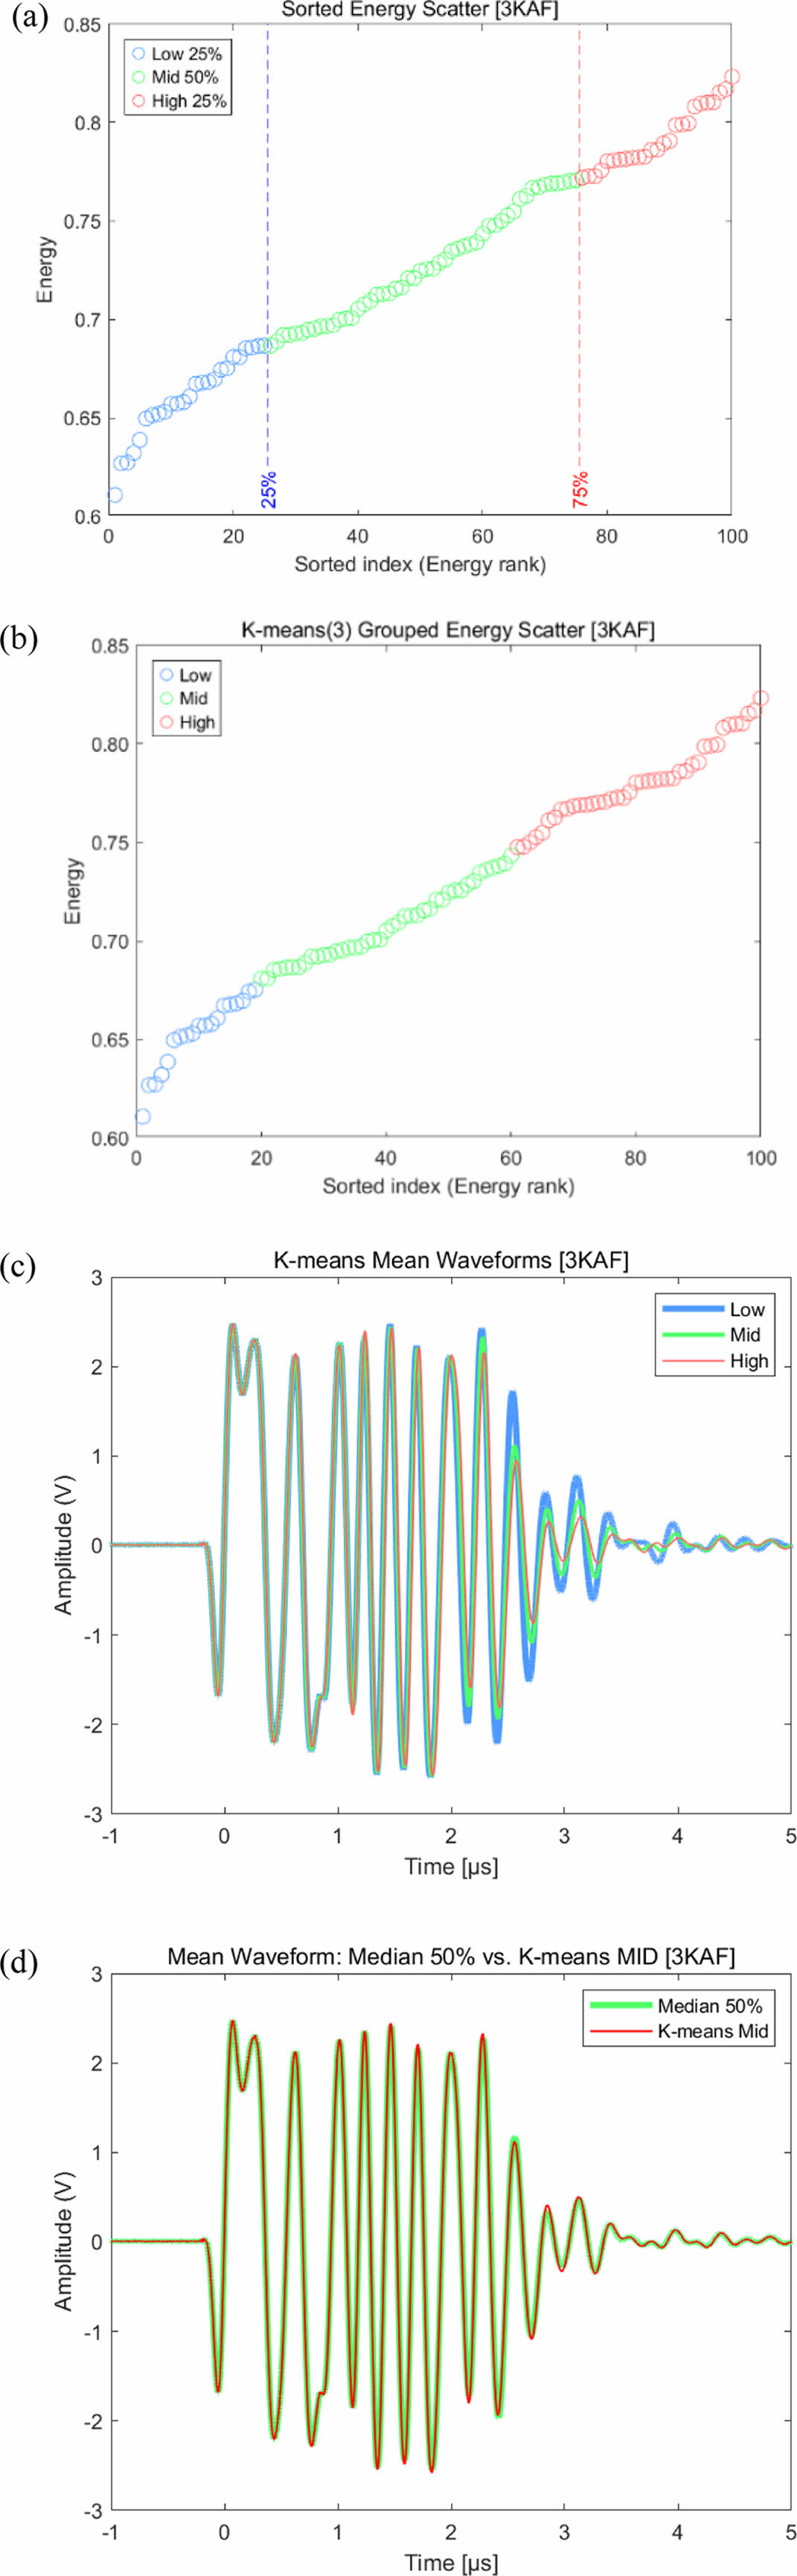
To ensure stable averaging, as shown in Fig. 3(a), the gate energy values for all 100 waveforms were sorted in ascending order, and only the median 50 waveforms, excluding the top and bottom 25%, were used to calculate the final averaged waveform. This approach minimizes the influence of outlier signals and enhances representativeness.
Additionally, as shown in Fig. 3(b–d), the energy values of all waveforms were classified into three groups (Low, Mid, High) by applying one-dimensional k-means (k=3) clustering. It was confirmed that the mean waveform of the mid group was highly similar to the mean waveform calculated from the median 50 signals, thereby verifying the statistical reliability of this averaging method.
Because the absolute energy change within the gated window alone may not fully reflect the overall characteristics of the entire waveform, the ratio of the gated energy to the total energy was introduced as a weighting factor. The interval weighting is defined by Eq. (3), where the gated RMS energy is the RMS of the averaged waveform within the interval, and the total RMS energy is the RMS over the full length of the signal.
Finally, the change in interval energy between the AF and NF specimens, according to adhesion status, was calculated by multiplying the difference by the weighting factor as shown in Eq. (4). Here, the RMS values for NF and AF refer to the RMS values of the corresponding averaged waveforms within the specified interval.
The start of the gating interval (ta) was automatically determined as the first peak after 1.8 μs in each averaged waveform (see Fig. 2(b)). This procedure enabled robust quantification of energy changes in the most critical interval of the waveform, ensuring the representativeness of the results within the full data set.
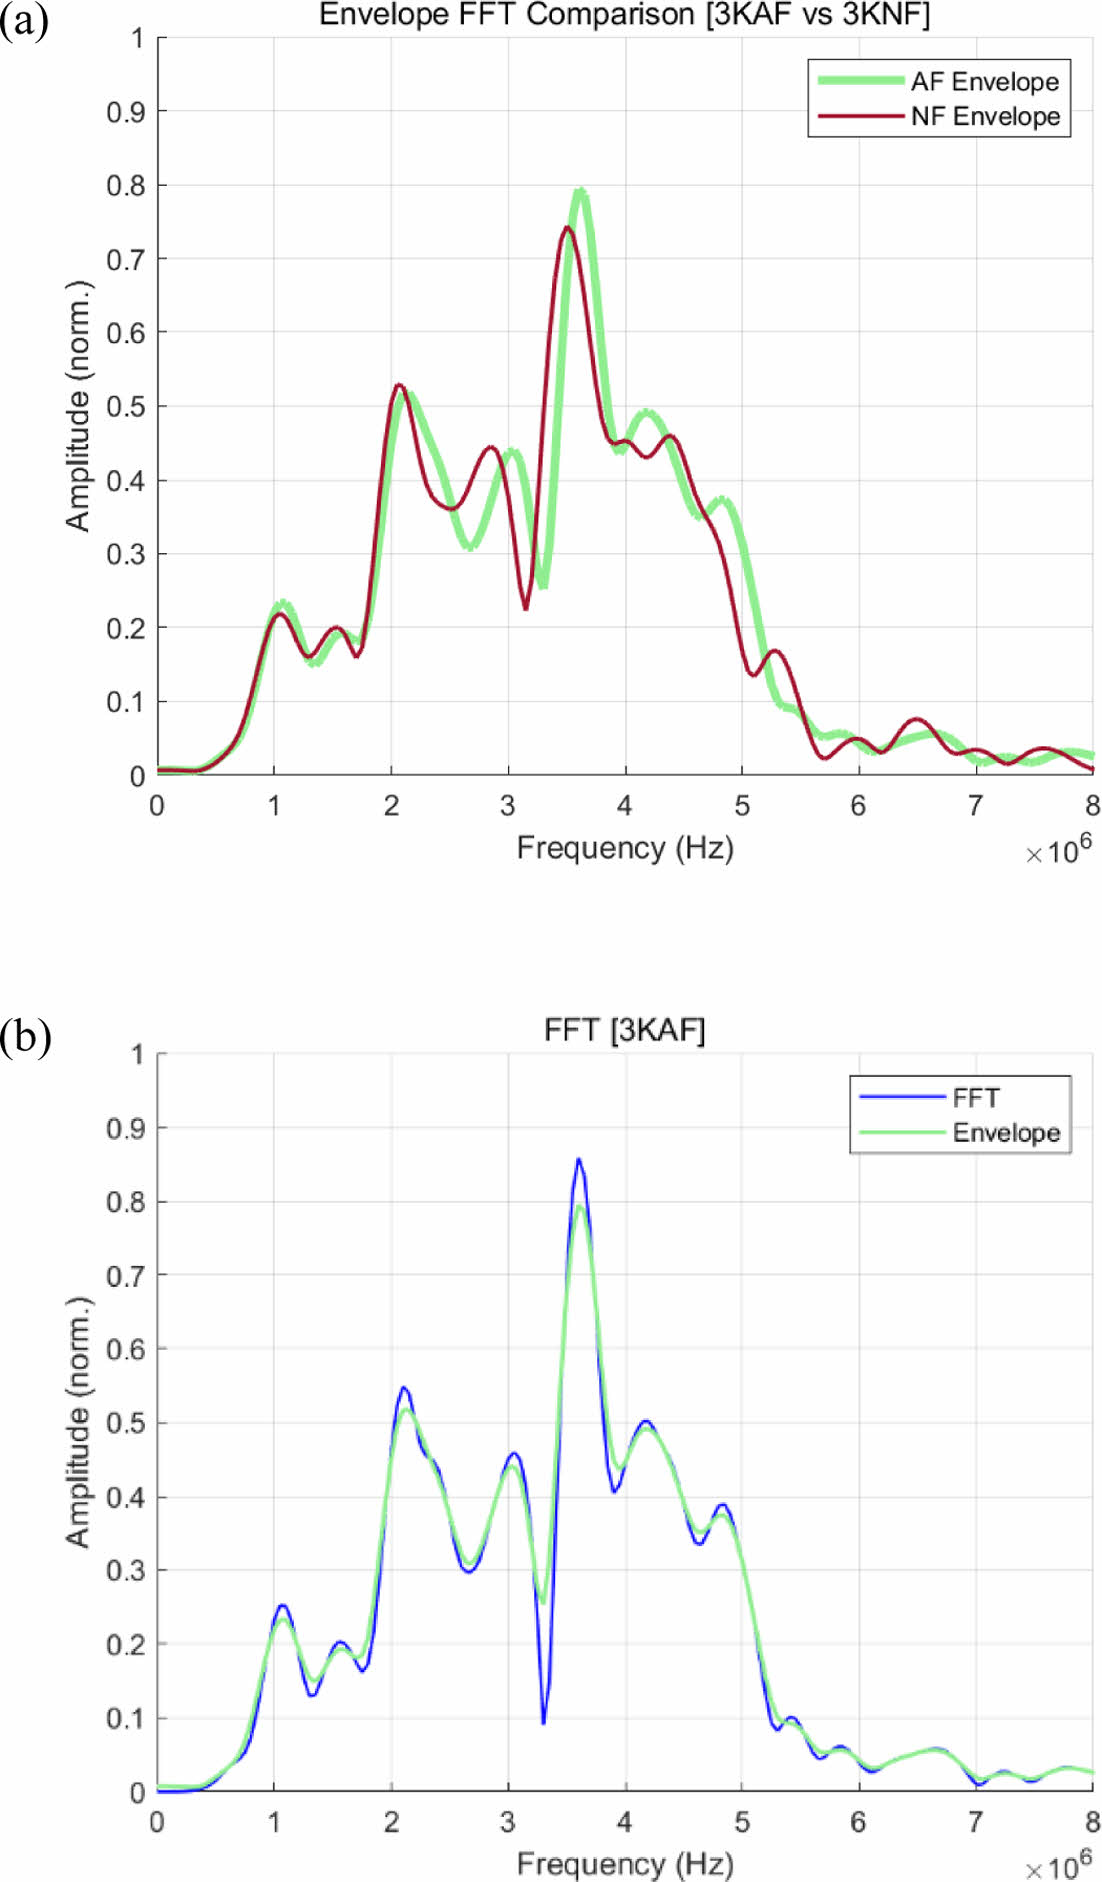
The Fast Fourier Transform (FFT) results, obtained using Eq. (5) (based on MATLAB discrete Fourier transform analysis), were normalized to a common reference value across all specimens. In addition, the envelope of the FFT spectrum was generated using the root mean square (RMS) method as described in Eq. (6).
|
Fig. 1 (a) Array test and (b) 3d printed jig |
|
Fig. 2 (a) 100 averaged waveform and (b) Peak detecting and weighted energy extraction |
|
Fig. 3 (a) Energy scatter with threshold, (b) Energy scatter with K-means, (c) K-means mean waveform and (d) Median Kmeans comparison |
3.1 Tensile Test Result
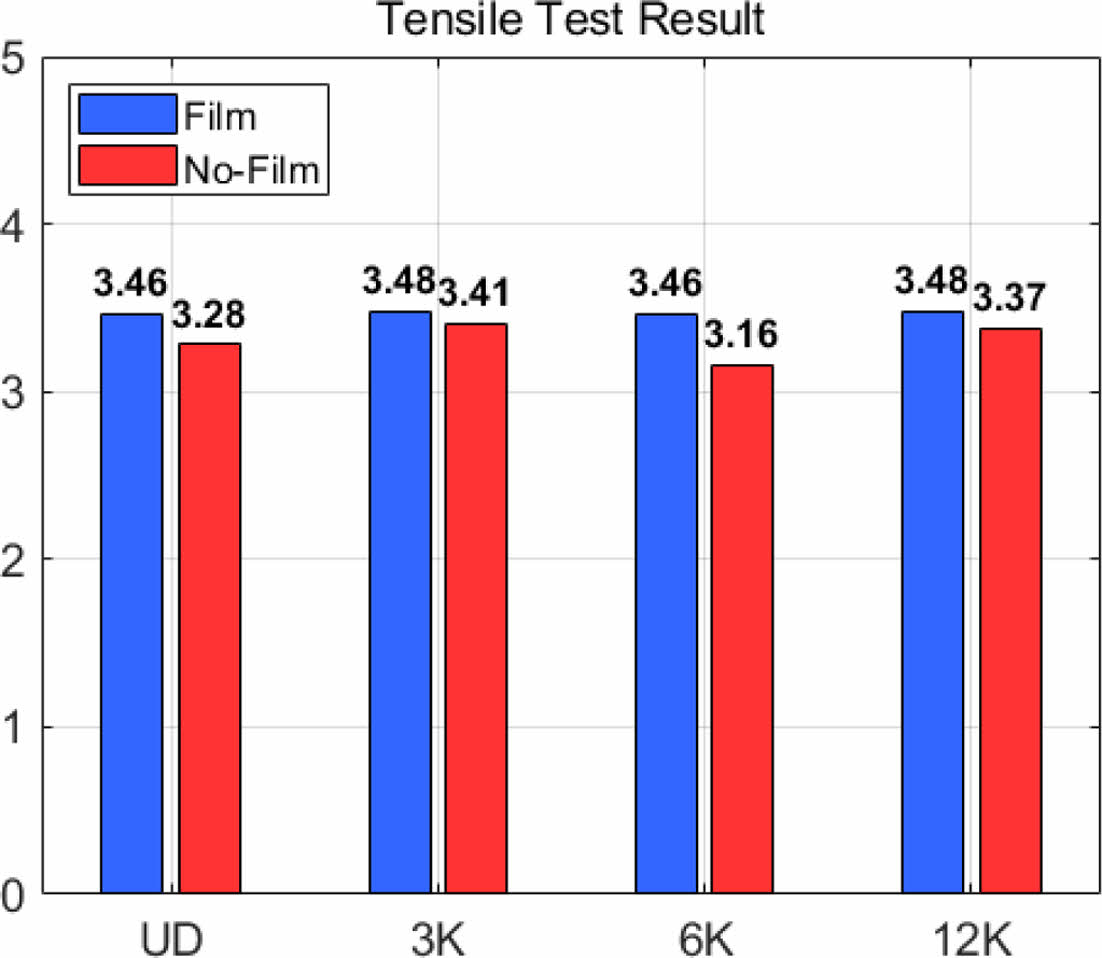
The average bonding strength of the specimens exhibited noticeable differences depending on the type of skin and the presence or absence of adhesive film. The tensile strength values for each condition are presented in Fig. 6.
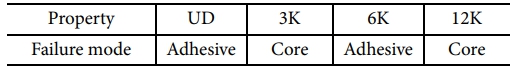
For all specimens fabricated with adhesive film, core failure consistently occurred regardless of skin type, suggesting uniform and stable bonding quality. The observed failure modes after testing are summarized in Table 2 and described below.
Core failure was observed in the 3K and 12K specimens. As shown in the photo in Fig. 5(b), the fracture occurred within the interior of the PVC foam while maintaining adhesion at the interface, indicating a sound bond between the skin and the core.
In contrast, adhesive debonding was found in the UD and 6K specimens. As seen in the photo in Fig. 5(a), delamination occurred along the skin–core boundary, suggesting possible bonding defects due to insufficient resin or weak adhesive strength at the interface.
3.2 Ultrasonic Result
3.2.1 Core failure group
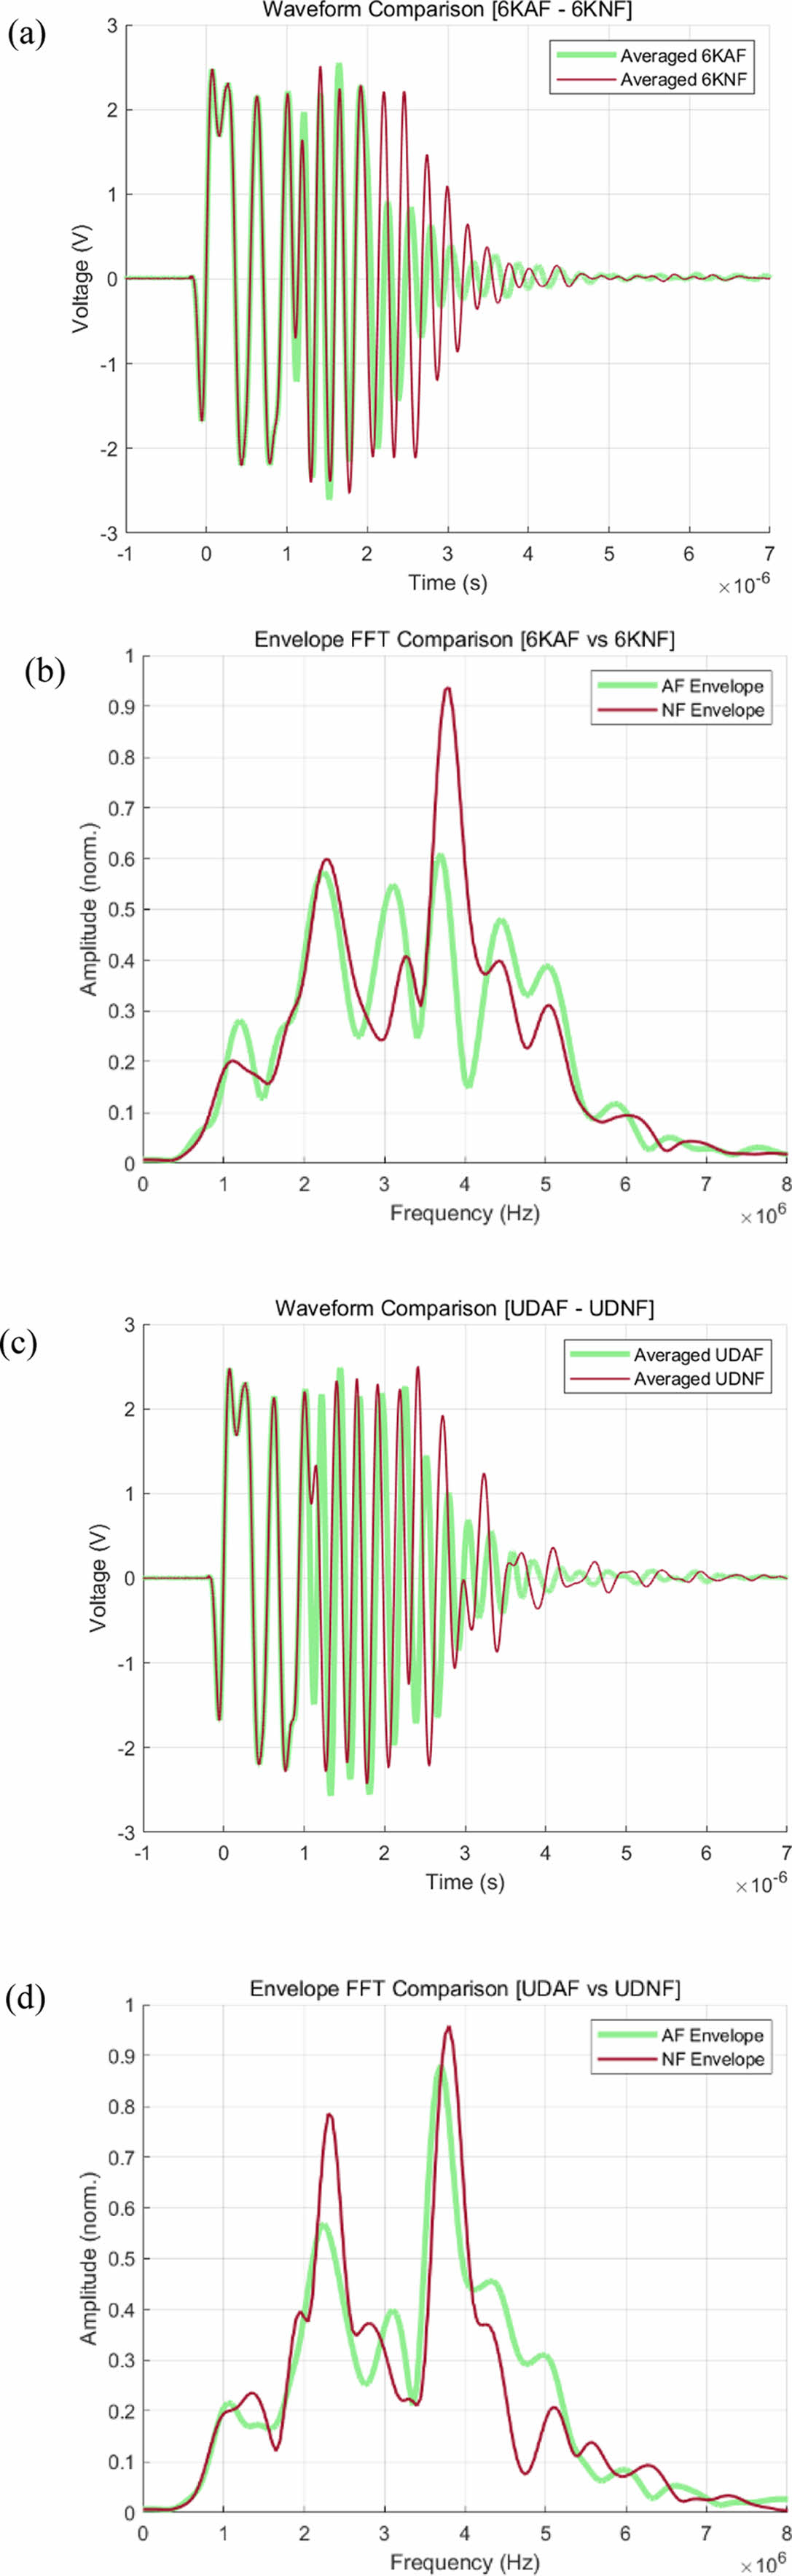
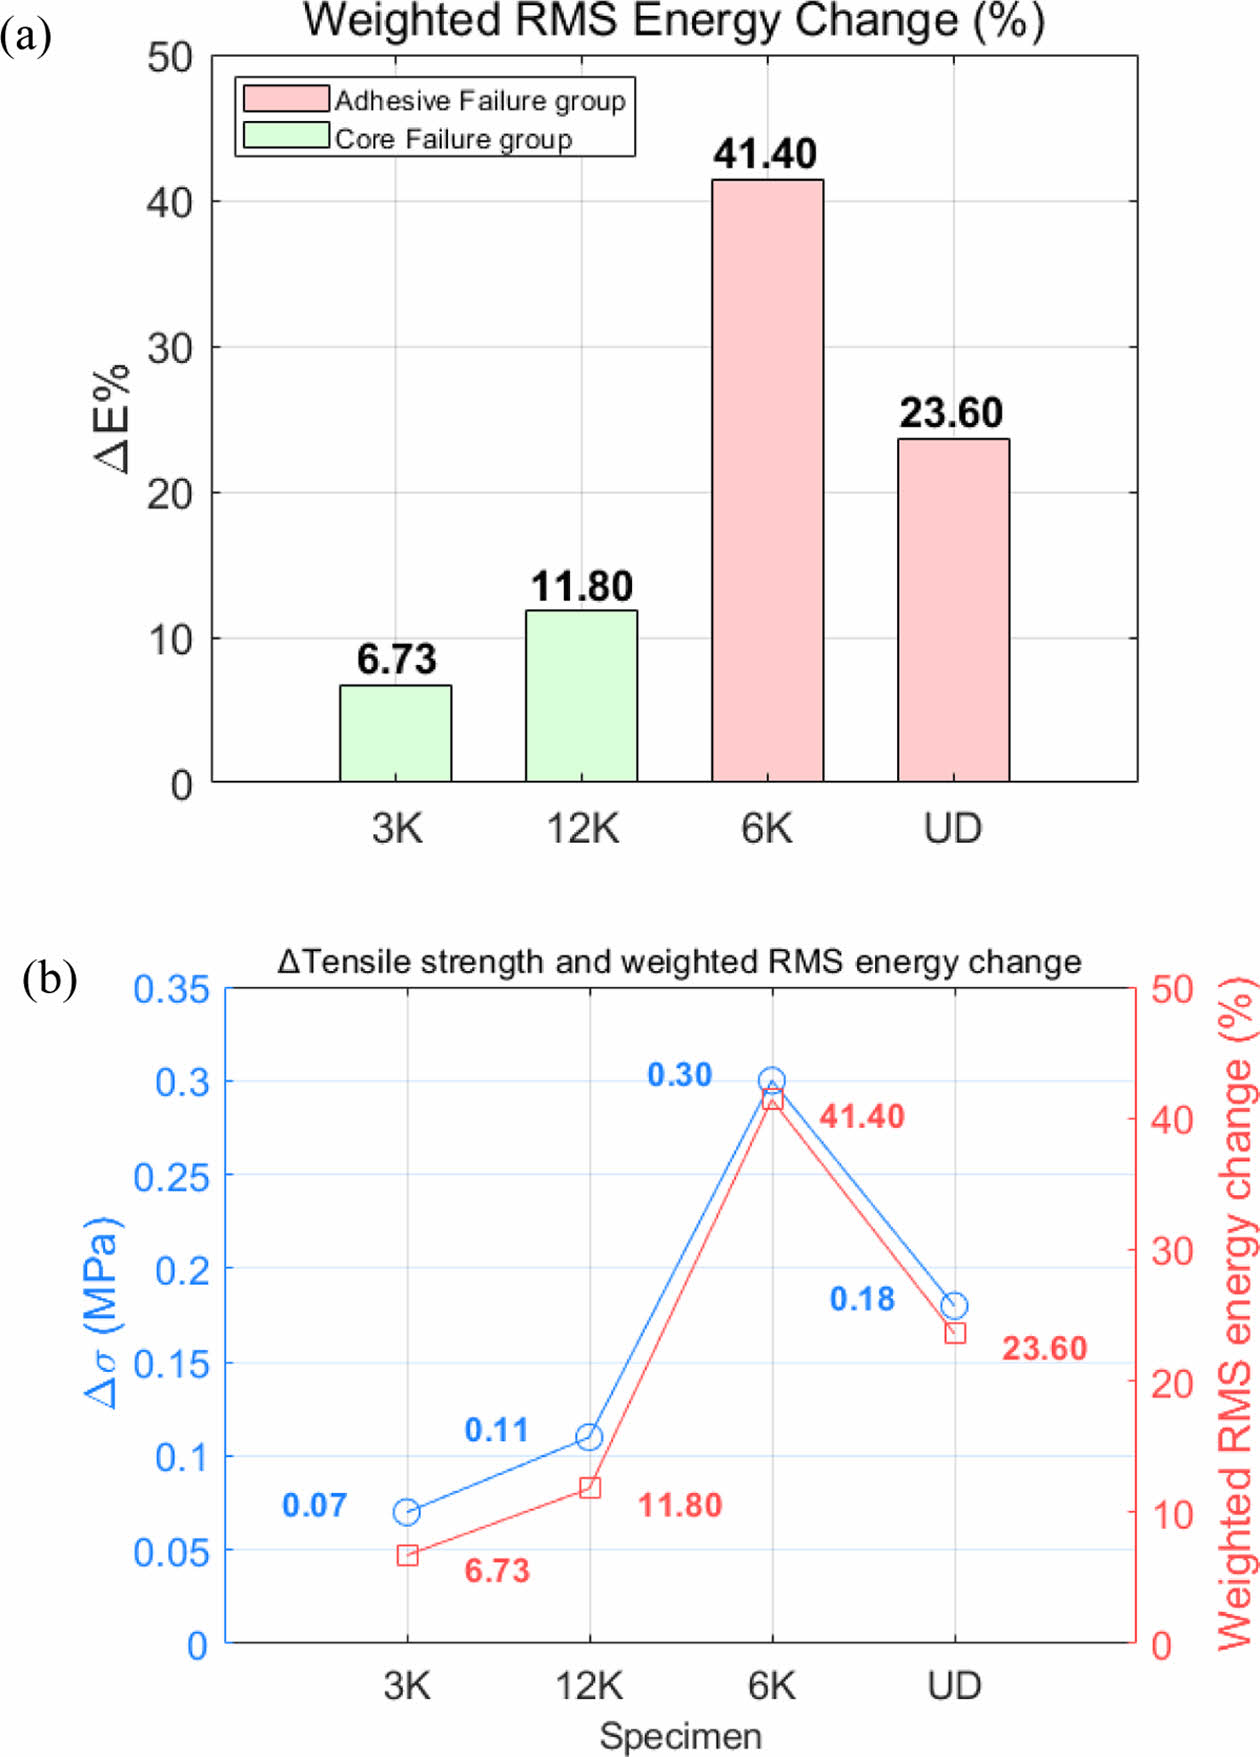
In the 3K specimen, shown in Fig. 7(a), the waveform gradually shifted toward the later part of the signal after 2.5 μs, and both AF and NF specimens exhibited clear attenuation as the signal approached the complete damping region. The average energy change rate in the 2–6 μs interval was 6.73%, as presented in Fig. 9(a), indicating only a minor difference according to the presence or absence of adhesive film.
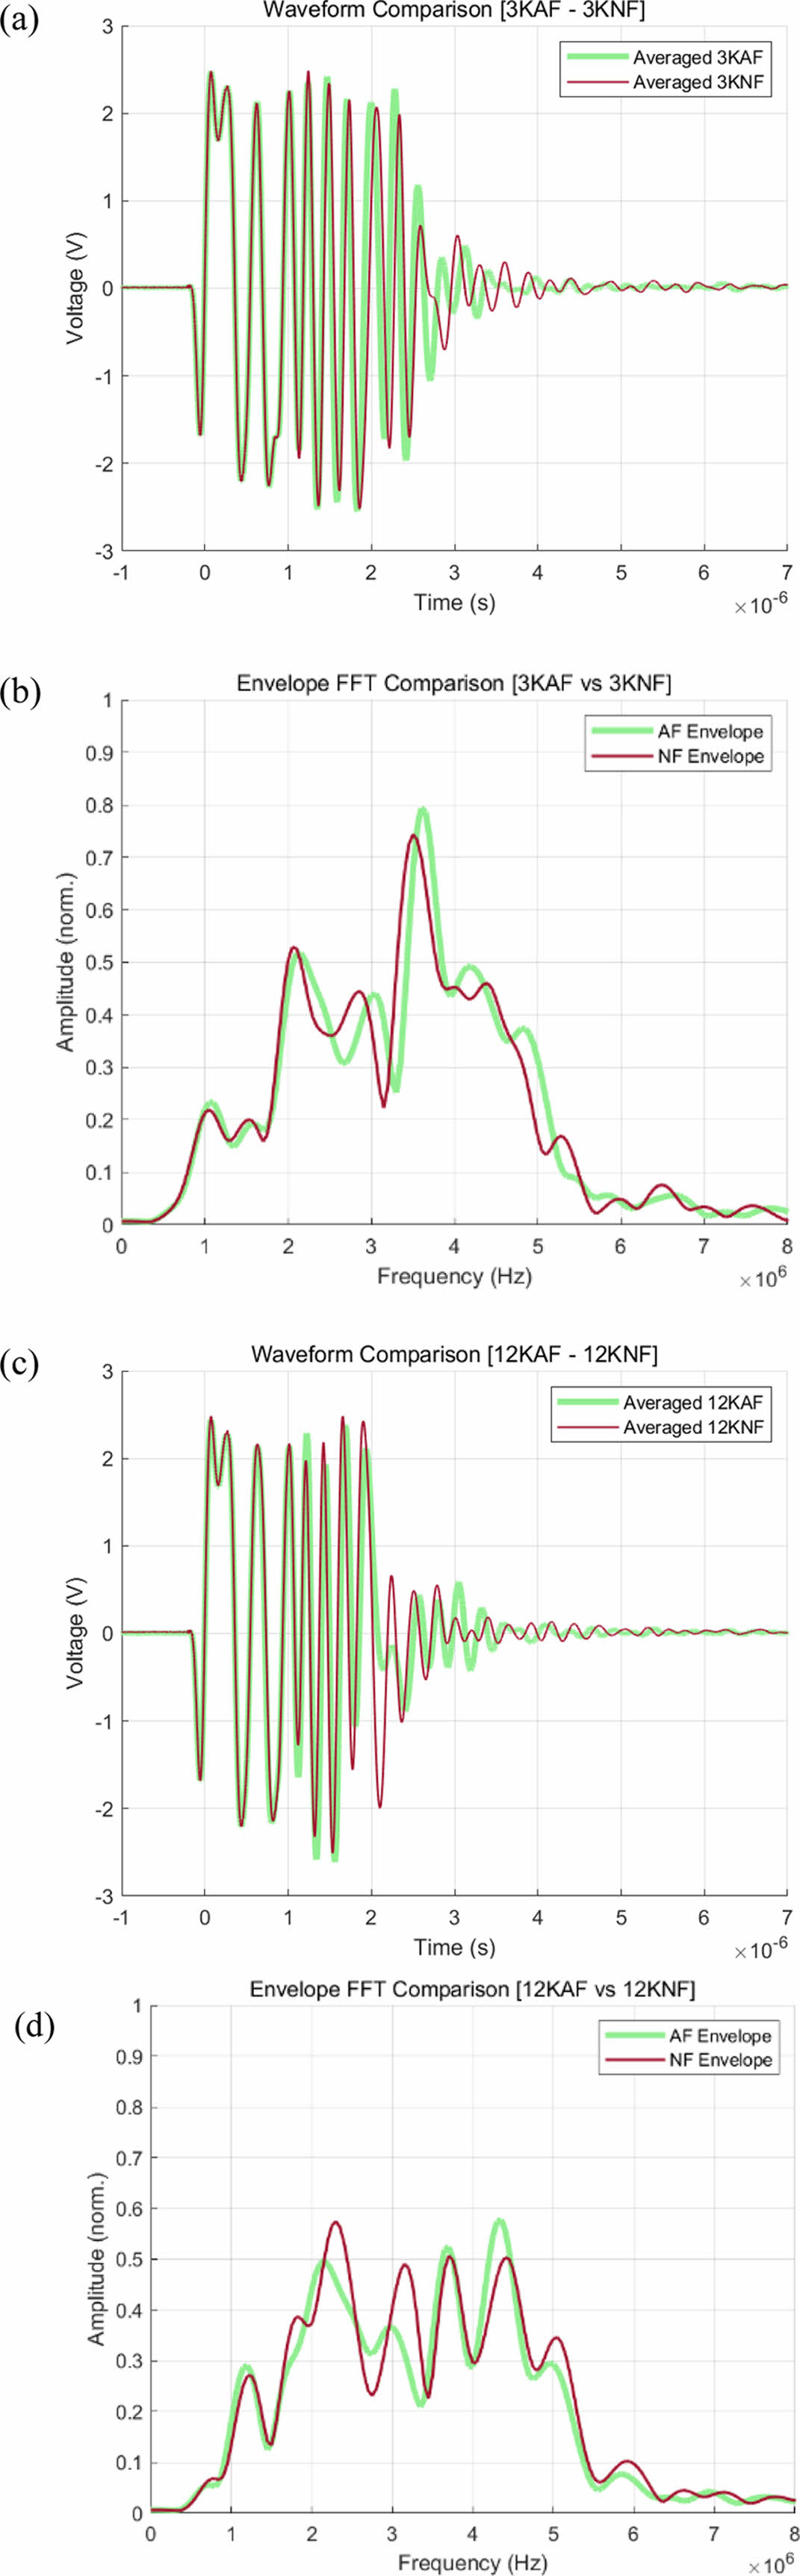
In contrast, the 12K specimen shown in Fig. 7(c) displayed a marked increase in peak amplitude after 2 μs, but beyond this point, both specimens exhibited similar attenuation behavior. The energy change rate for the 12K specimen in the same interval was 11.8%, which is notably higher than that of the 3K specimen.
FFT analysis revealed, as shown in Fig. 7(b), that the spectral shapes of the 3K specimens were nearly identical between AF and NF, though a slight forward frequency shift was observed in the NF group. On the other hand, Fig. 7(d) shows that the NF spectrum of the 12K specimen exhibited increased peaks in the 2–2.5 MHz and 2.5–3.5 MHz ranges, along with more significant spectral changes overall.
These changes in waveform and frequency response are interpreted as being caused by uneven resin distribution due to adhesive film removal, which is further supported by the energy visualization results discussed in the next section.
3.2.2 Adhesive failure group
In the adhesive failure group, waveform analysis revealed that both the UD and 6K specimens exhibited increased signal amplitudes near the bonding interface (complete attenuation point). Fig. 8(a) and (c) show the averaged waveform comparisons for 6K and UD specimens, respectively. In both cases, the NF signals displayed forward shifts and rapid amplitude growth after 2 μs, attributed to reduced inspection depth caused by adhesive delamination. Quantitatively, the average energy change rate of the NF specimens was 41.4% for 6K and 23.6% for UD compared to their AF counterparts.
In the frequency domain, both specimens exhibited increased peaks around 4 MHz, along with slight rearward frequency shifts, as seen in Fig. 8(b) and (d). The UD specimen also showed an additional peak increase near 2.5 MHz.
While the 6K specimen showed clear distinction between AF and NF signals in both waveform and FFT spectra, the UD specimen exhibited less clear separation. These findings suggest that conventional FFT-based qualitative analysis alone has limitations in quantitatively classifying bonding conditions.
In contrast, the Weighted RMS Energy Change proposed in this study effectively differentiated core and adhesive failure groups, as demonstrated in Fig. 9(a). Moreover, as shown in Fig. 9(b), this metric exhibited a strong correlation with changes in tensile strength (Δσ), confirming its utility as a physical indicator of bonding quality.
Traditionally, ultrasonic A-scan analysis relies on signal amplitude and time-of-flight (TOF) to qualitatively infer the presence of defects. However, this study experimentally demonstrated that integrating the squared amplitude over time to calculate energy, and then evaluating its rate of change, provides a quantitative metric that closely reflects actual interfacial tensile strength.
It should be noted, however, that identifying the precise threshold for failure would require additional experiments using specimens with varied resin content. Nevertheless, the energy-based metric proposed here offers meaningful potential as a reliable criterion for classifying bonding quality in composite sandwich structures.
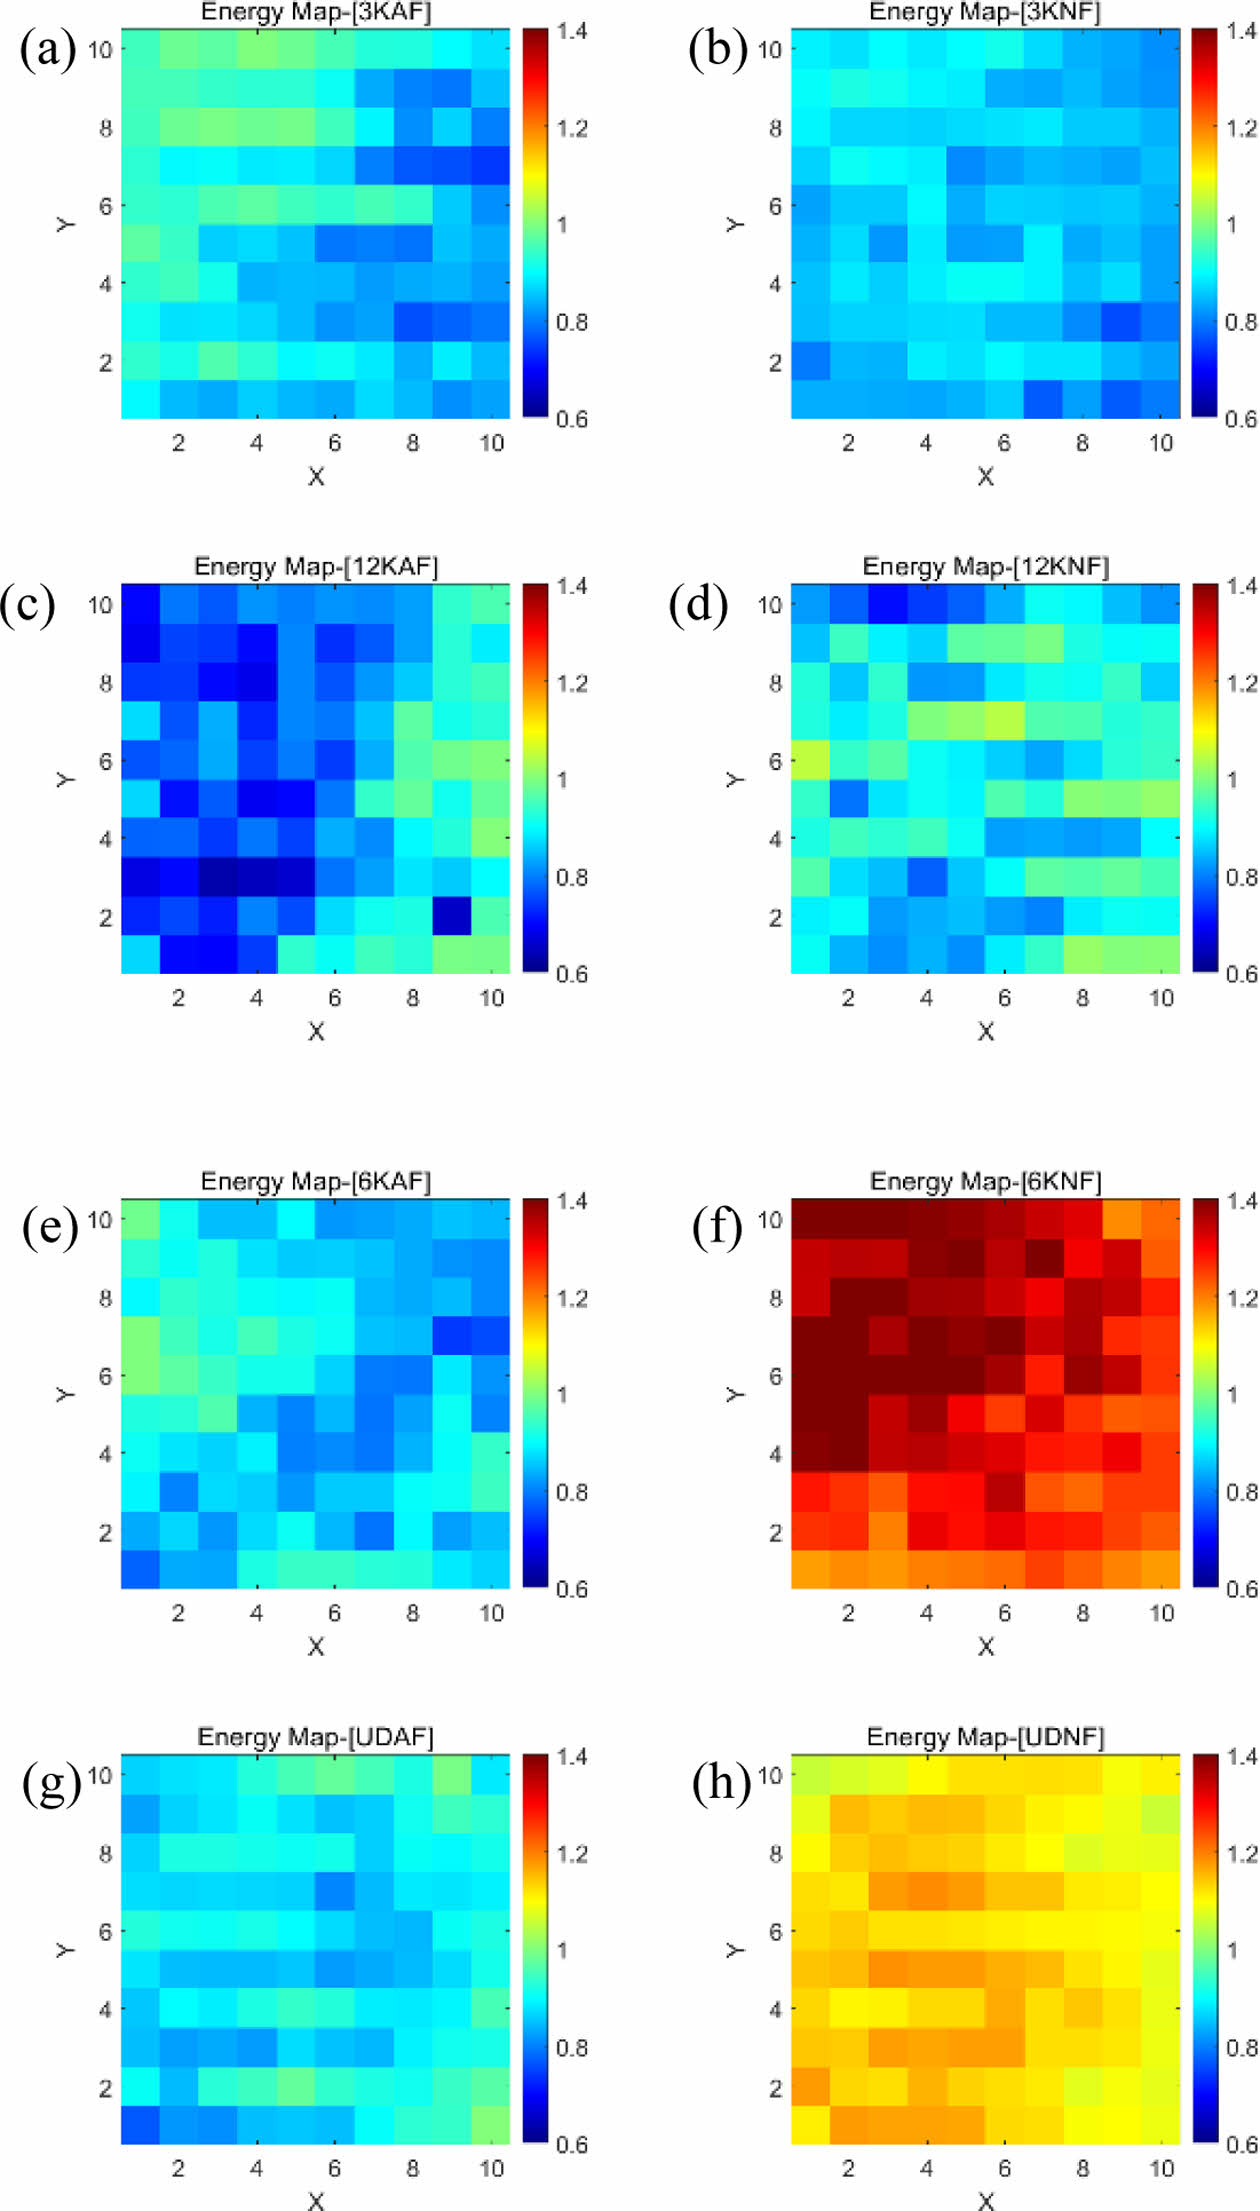
3.2.3 Ultrasonic Energy Map
RMS energy was calculated from each A-scan signal acquired over a 10 × 10 grid within a predefined time window and normalized by the maximum AF group value of each specimen to generate energy distribution maps (Fig. 10). These maps visualize the spatial energy variations and clearly differentiate bonding quality based on the presence of adhesive film and failure mode groups.
In the core failure group (3K, 12K), both specimens showed relatively low energy contrast. However, the 12K specimen exhibited greater variation and spatial irregularity in energy, consistent with earlier waveform and FFT analysis that indicated resin non-uniformity and unstable signal propagation.
In the adhesive failure group (6K, UD), widespread high-energy regions were observed in the NF specimens, particularly in 6KNF where many areas exceeded a normalized energy value of 1.2. This is attributed to strong ultrasonic reflections from fully separated adhesive interfaces forming air gaps.
A noteworthy point is that no significant 2 MHz FFT peak was observed in the 6K specimen, suggesting that the waveform remained clean due to complete debonding rather than resin irregularities. In contrast, the UD and 12K specimens showed clear increases in the 2 MHz band, indicating early-stage debonding caused by scattering from resin non-uniformity.
The 4 MHz FFT components increased in both adhesive failure specimens, representing strong reflections from air layers formed by adhesive delamination—characteristic of fully debonded interfaces.
Ultrasonic energy maps offer an intuitive, spatially resolved assessment of bonding quality. The increase in the 2 MHz band reflects incipient debonding due to resin scatter, while the 4 MHz rise signifies total interface separation. This approach provides both qualitative and quantitative insight, especially for cases where waveform and FFT analyses alone may be ambiguous.
A potential qualitative interpretation can be derived from the color distribution in the normalized energy maps. In this study, regions exhibiting yellow or warmer tones (corresponding to normalized energy values exceeding approximately 1.0) frequently appeared in specimens exhibiting adhesive delamination. These regions may be indicative of strong ultrasonic reflections from interface discontinuities or entrapped air, which result in localized high-energy responses. Such trends were notably observed in the 6KNF and UDNF specimens.
Areas colored in yellow or above may serve as visual cues for debonded regions, suggesting that the normalized energy distribution map could serve as a qualitative indicator for bond integrity assessment. However, this interpretation may be influenced by variations in sample properties and geometry, and further parametric investigations and statistical validations are required to generalize this diagnostic approach.
3.3 Optical Microscopic Analysis
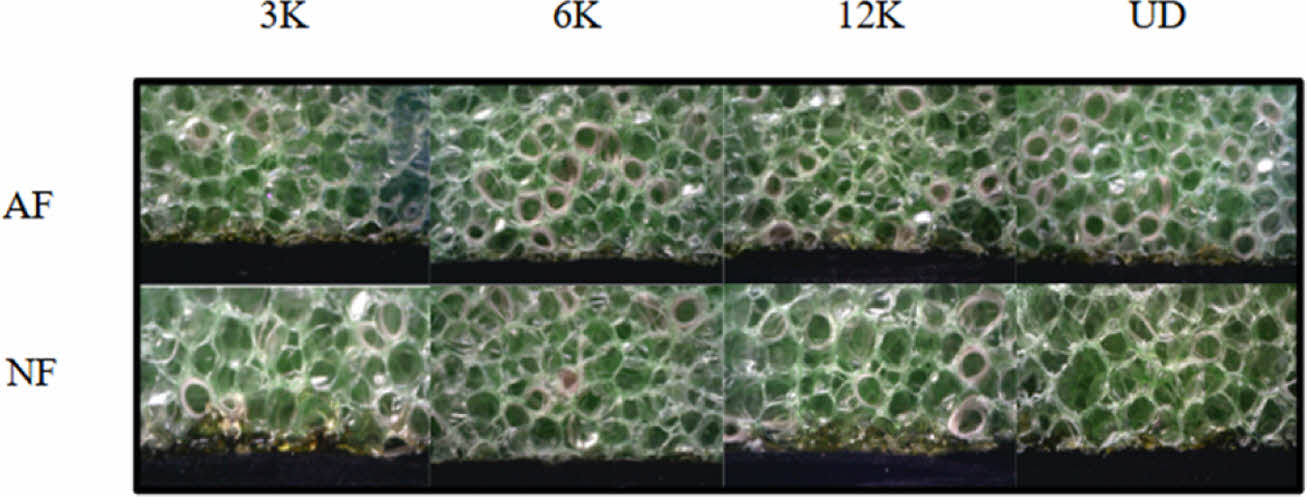
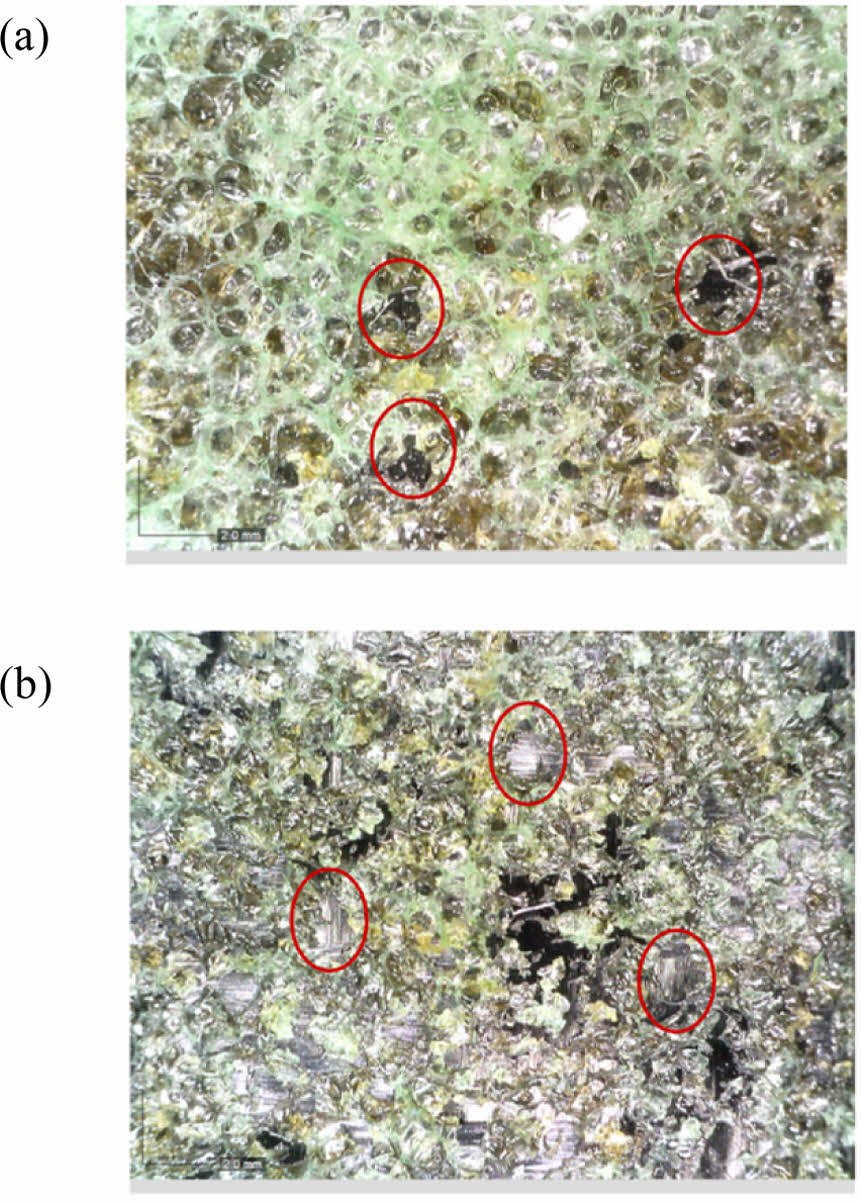
To evaluate the bonding condition between the CFRP skin and the PVC foam core, optical microscopy was used to examine the cross-sectional interface of the specimens. Fig. 11 presents optical microscopic side-view microscopic images of different skin types (UD, 3K, 6K, 12K) under two conditions: with adhesive film (AF) and without adhesive film (NF). In the AF group, resin was uniformly distributed along the foam surface across all skin types, resulting in consistently strong bonding at the interface. In contrast, the NF group displayed distinct differences depending on the skin type, indicating variable bonding performance. In particular, specimens with UD skin exhibited insufficient residual resin, leading to incomplete bonding between the skin and the core. As seen in the optical microscopic photo in Fig. 12(a), certain regions revealed resin-starved areas where proper adhesion had not formed, resulting in bonding gaps and concentrated stress points. These regions often corresponded with fiber fracture zones, suggesting that local debonding was a major contributor to premature failure during mechanical testing. Similarly, the 6K specimens also showed irregular adhesive coverage and internal voids, as highlighted in Fig. 12(b), reinforcing the observed correlation between resin distribution and adhesion integrity.
|
Fig. 4 (a) FFT comparison and (b) RMS envelope |

|
Fig. 5 (a) Adhesive failure and (b) Core failure |
|
Fig. 6 Tensile test result (MPa) |
|
Fig. 7 (a) 3K waveform comparison, (b) 3K FFT comparison, (c) 12K waveform comparison and (d) 12K FFT comparison |
|
Fig. 8 (a) 6K waveform comparison, (b) 6K FFT comparison, (c) UD waveform comparison and (d) UD FFT comparison |
|
Fig. 9 (a) Weighted RMS energy change and (b) Delta tensile strength and weighted RMS energy change |
|
Fig. 10 Energy map (a) 3KAF, (b) 3KNF, (c) 12KAF, (d) 12KNF, (e) 6KAF, (f) 6KNF, (g) UDAF and (h) UDNF |
|
Fig. 11 Optical microscopic side image (x200) |
|
Fig. 12 Optical microscopic adhesive area image (x200) (a) UD and (b) 6K |
This study investigated the ultrasonic A-scan response characteristics of co-cured CFRP/PVC foam core sandwich composites under various bonding conditions and demonstrated a quantitative method to evaluate bond integrity based on energy features. By acquiring A-scan waveforms from a 10×10 grid, followed by waveform averaging, time-frequency domain analysis, and energy normalization, the differences between well-bonded (AF) and non-bonded (NF) specimens were clearly distinguished.
In the core failure group, the 3K specimen showed minimal energy change (ΔE = 6.73%) and negligible differences between AF and NF signals, indicating sound bonding. In contrast, the 12K specimen exhibited a moderate energy change (ΔE = 11.80%) along with slight frequency shifts, suggesting initiation-level debonding due to non-uniform resin distribution.
In the adhesive failure group, the 6K specimen demonstrated a distinct energy change of 41.40% and clear separation of waveforms and FFT spectra, indicating complete delamination accompanied by mechanical degradation. The UD specimen showed a 23.60% change in energy and growth in both 2.5 MHz and 4 MHz FFT peaks, implying progressed but not fully distinguishable debonding behavior.
The FFT analysis revealed that the presence of 2 MHz-band energy increase is associated with early-stage debonding caused by resin scattering, whereas a prominent 4 MHz component is interpreted as complete interfacial separation due to high-frequency reflection from air gaps. The absence of 2 MHz peaks in 6K despite complete delamination further supports this hypothesis.
Additionally, energy mapping provided a spatial visualization of bonding quality, where specimens with delamination exhibited higher and more heterogeneous normalized energy distributions. Specifically, regions with normalized energy values exceeding ~1.0 (yellow and above) were frequently observed in NF samples of the adhesive failure group, suggesting their potential as qualitative indicators of bonding degradation. However, this threshold-based interpretation requires further statistical validation.
Overall, the proposed Weighted RMS Energy Change serves as a robust quantitative index for differentiating bond quality, offering an effective alternative to conventional qualitative TOF or amplitude-based ultrasonic assessments. This approach demonstrates strong correlation with mechanical test results and presents a viable path toward quantitative NDT (QNDT) of composite sandwich structures. While limitations remain—particularly regarding the exact damage thresholds due to limited resin control experiments—the findings suggest promising directions for expanding ultrasonic debonding diagnostics in future work.
This work was supported by the New and Renewable Energy Core Technology Development (R&D) Programs of the Korea Energy Technology Evaluation and Planning (RS-2024-00449355).
- 1. Vinson, J.R., The Behavior of Sandwich Structures of Isotropic and Composite Materials, Technomic Pub. Co., Lancaster, UK, 1999.
-

- 2. Singh, P., Sheikh, J., and Behera, B.K., Flexural behaviour of 3D-woven Fabric-reinforced Epoxy Composite Core-based Metal-faced Sandwich Panels. In Behera, B.K., Takatera, M., & Mishra, R.K. (Eds.), Adv Multifunct Compos IJTRC 2023. Springer, Singapore, pp. 25-34, 2025.
-
- 3. Park, Y.B., Yang, H.J., Kweon, J.H., Choi, J.H., and Cho, H.I., “Failure of Composite Sandwich Joints under Pull-Out Loading,” Journal of the Korean Society for Composite Materials, Vol. 14, No. 1, 2011, pp. 17-23.
-
- 4. Jang, W.C., and Roh, H.D., “Sandwich Composites Manufacturing: A Review of Materials, Methods, Applications and Challenges,” International Journal of Precision Engineering and Manufacturing, Springer, Vol. 26, 2025, pp. 2093-2109.
-
- 5. Khan, T., Acar, V., Aydin, M.R., Hülagü, B., Akbulut, H., and Seydibeyoğlu, M.Ö., “A Review on Recent Advances in Sandwich Structures Based on Polyurethane Foam Cores,” Polymer Composites, Vol. 41, No. 6, 2020, pp. 2355-2400.
-
- 6. Ibrahim, M.E., “Nondestructive Evaluation of Thick-section Composites and Sandwich Structures: A Review,” Composites Part A: Applied Science and Manufacturing, Vol. 64, 2014, pp. 36-48.
-
- 7. Wu, J.H., Yang, J.S., Zhang, X.Y., Fu, L.L., Li, S., Wu, L.Z., Schmidt, R., and Schröder, K.U., “A Neural Network-based Air-coupled Ultrasonic Damage Detection Method for Composite Honeycomb Sandwich Structure,” Mechanical Systems and Signal Processing, Vol. 233, 2025, 112789.
-
- 8. Santos, M., Santos, J., Reis, P., and Amaro, A., “Ultrasonic C-scan Techniques for the Evaluation of Impact Damage in CFRP,” Materials Testing, Vo. 63, No. 2, 2021.
-
- 9. Yang, H., Yang, L., Yang, Z., Shan, Y., Gu, H., Ma, J., Zeng, X., Tian, T., Ma, S., and Wu, Z., “Ultrasonic Detection Methods for Mechanical Characterization and Damage Diagnosis of Advanced Composite Materials: A Review,” Construction and Building Materials, Vol. 324, 2023, 117554.
-
 This Article
-
2025; 38(4): 458-467
Published on Aug 31, 2025
- 10.7234/composres.2025.38.4.458
- Received on Jul 31, 2025
- Accepted on Aug 9, 2025
Services
- Abstract
1. introduction
2. experimental setup
3. result and discussion
4. conclusions
- Acknowledgements
- References
- Full Text PDF
Shared
Correspondence to
- Hyung Doh Roh
-
* Department of Mechanical Engineering, Hanyang University ERICA
** BK21 Four ERICA-ACE Center, Hanyang University ERICA - E-mail: rhd1213@hanyang.ac.kr
Gangnam Mirae Tower, Suite 601, 174 Saimdang-ro, Seocho-gu, Seoul 06627, South Korea
Tel: +82-2-598-1550 Fax: +82-2-598-1557 E-mail: composites@kscm.re.kr